UpSet
Example Data
df =  mtcars
df[df>0] = 1
df[df<=0] = 0
for ( i in 1:min(ncol(df),nrow(df)) ){
  df[i,i] = 0
}

sample_names = colnames(df)
feature_names = rownames(df)


## Used for queries
## NotUpsetVal column is not 0/1, thus will be neglected in upsetR plot

df$NotUpsetVal = 1:nrow(df)
UpSetR
library(UpSetR)
library(ggplot2)    ## for attributeplots


## Define a query func
my_btw <- function(row,rowname, min, max){
  newData <- (row[rowname] < max) & (row[rowname] > min)
}

## Define a attributeplot func
plot1 <- function(mydata, x){
  myplot <- (
    ggplot(df,aes(x,x))+ geom_point()
  )
}

## attributeplots
attributeplots <- list(gridrows = 55,
                       plots = list(
                         list(plot = plot1, x= "NotUpsetVal",  queries = FALSE),
                         list(plot = plot1, x= "NotUpsetVal", queries = TRUE)
                         ),
                       ncols = 3)


## Upset Plot
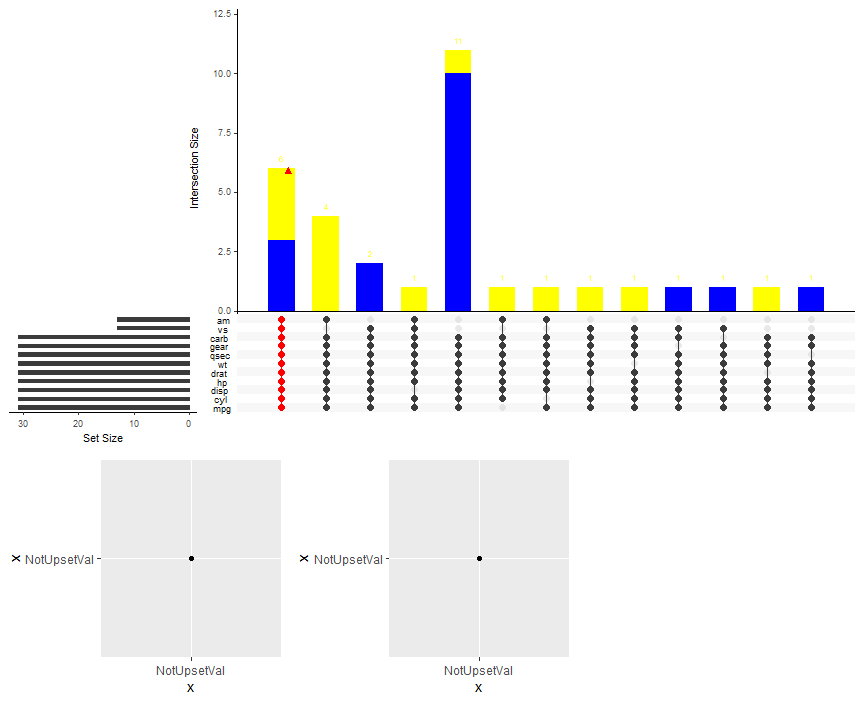
upset(df,
      sets = sample_names,
      order.by = c('freq', 'degree'),
      decreasing = c(TRUE, TRUE),
      attribute.plots = attributeplots,
      queries = list(
        list(query = intersects, params = sample_names, color = 'red'),
        list(query = my_btw, params = list('NotUpsetVal',6,25), color = 'blue', active = TRUE)
      ),
      main.bar.color = "yellow"     # default black
)
参考
link